Written By Zsolt Jirka
| Key Takeaways | Description |
|---|---|
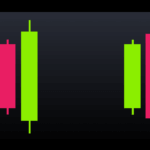
| Understanding Inside Bars | Inside bar candles are smaller candles contained within the range of a previous larger candle, indicating market indecision. |
| Significance of Inside Bars in Trends | In uptrends, an inside bar that doesn’t break the previous high may signal a selling opportunity. In downtrends, an inside bar that doesn’t break the previous low can indicate a buying opportunity. |
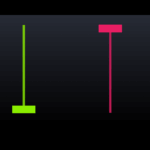
| Indecision and Breakouts | The smaller the inside bar, the stronger the indecision. A failed breakout increases the chance of a trend reversal. |
| Application in Trading | Inside bars can be used to identify potential reversals, especially at strategic locations like support and resistance levels. |
| Practical Advice | Use inside bar patterns as a confluence factor rather than trading on them alone; practice is essential for mastering their identification. |
Introduction to Inside Bar Patterns
Have you ever noticed tiny candles on stock charts seemingly contained within the bigger ones before? Those are called inside bars, and they hold valuable clues for traders! In this article, we are going to break down the inside bar pattern in a simple way. This can help you identify potential buying and selling opportunities in any market.
After learning about the inside bar pattern, I found it really useful. I use it daily for backtesting, and it provides me with more information.
Analyzing Inside Bars in Market Trends
The market is driven by the balance between buyers and sellers.
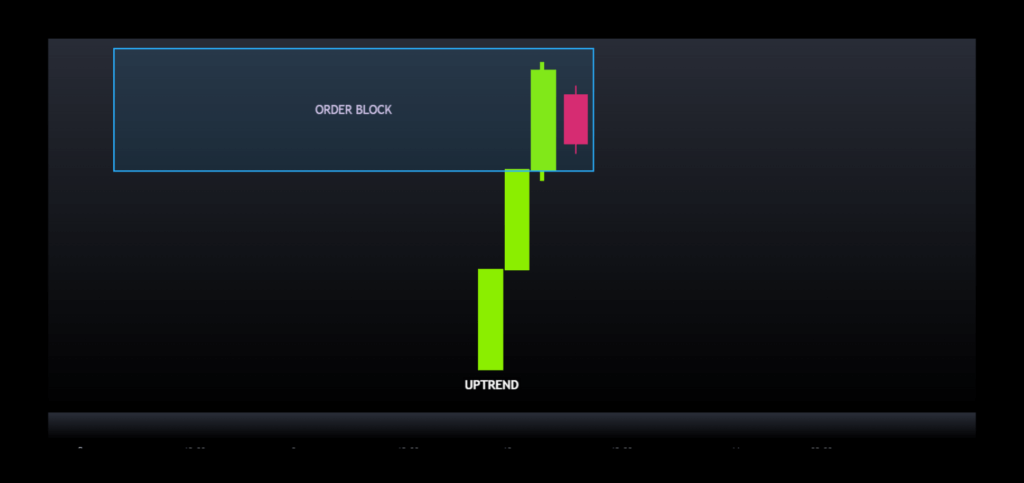
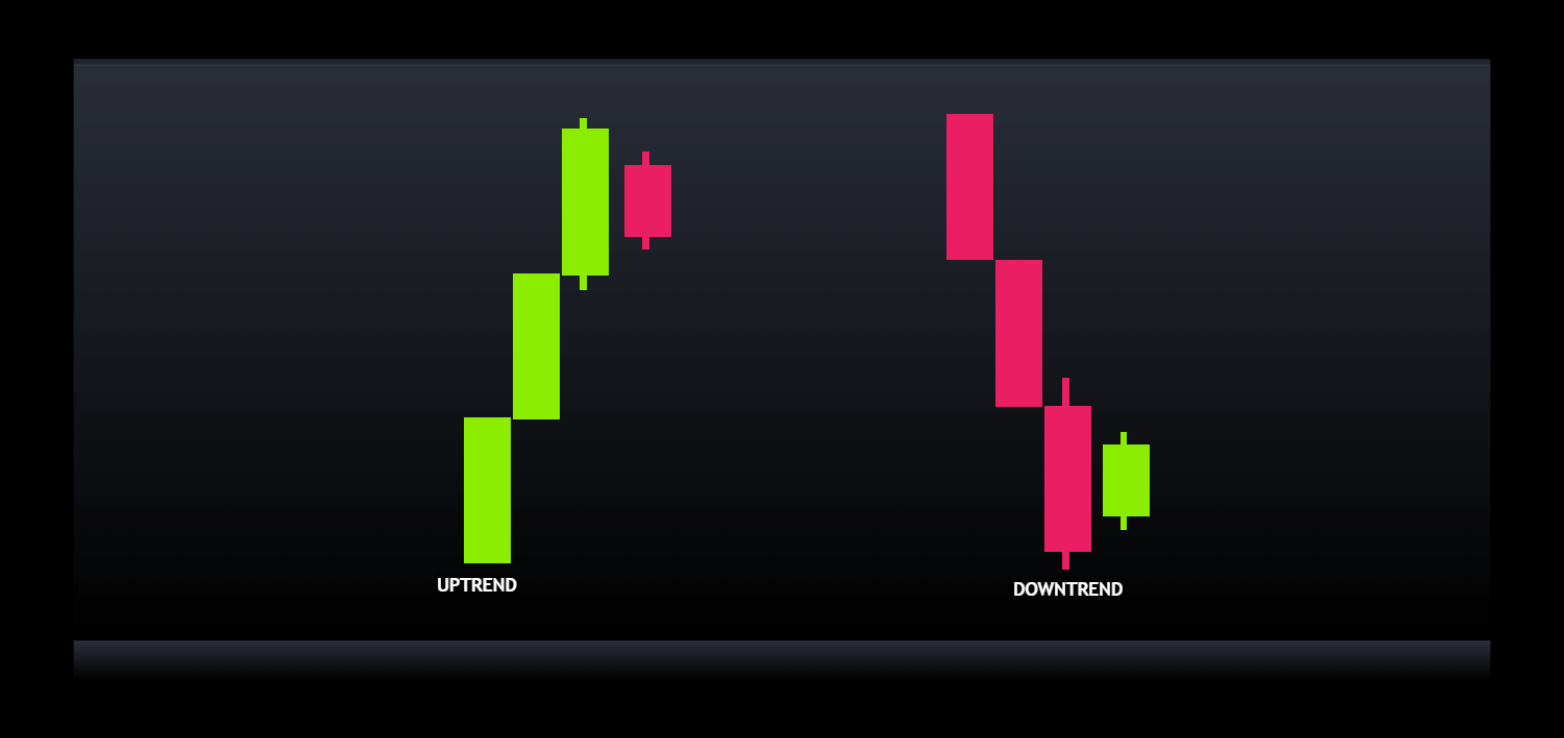
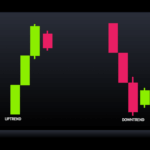
An uptrend forms when buyers have the upper hand, pushing the price higher (like the first candle). An inside bar appears when this upward movement pauses. The price stays within the range (high and low) of the previous candle, suggesting a brief moment of indecision. This can also be more than one candle. The key element to watch for is the failed breakout. If the inside bar doesn’t surpass the high of the previous candle in an uptrend, it signals weakening buyers. This could be a good time to consider selling (going short).
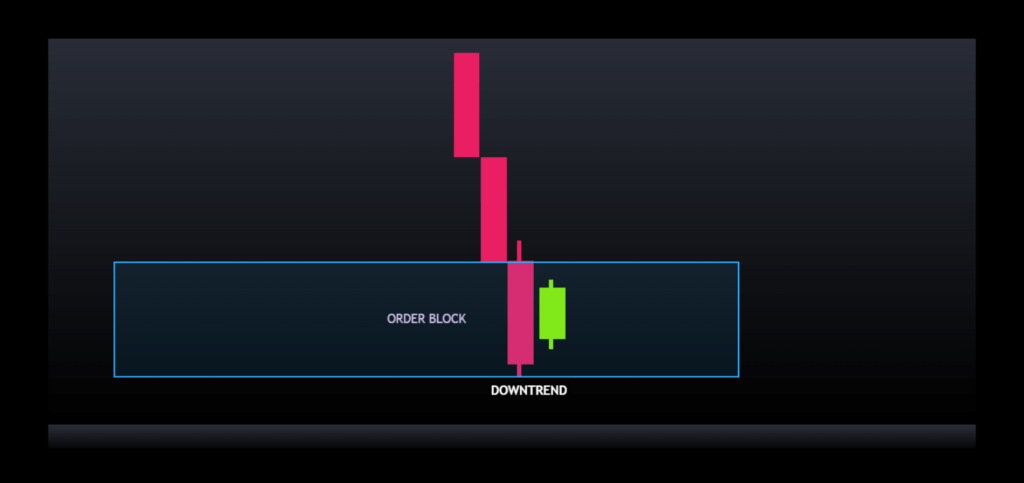
The same logic applies in a downtrend. Sellers are in control, driving the price down (first candle). An inside bar emerges, indicating a temporary halt in the decline. If the inside bar fails to break below the low of the previous candle, it suggests sellers losing momentum. Also, here, it can be more than one inside candle. This might be a potential buying (going long) opportunity.
Remember:
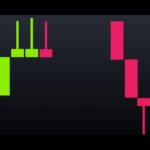
- The smaller the inside bar, the stronger the indecision between buyers and sellers.
- A failed breakout (higher high in uptrends, lower low in downtrends) within the inside bar increases the chance of a trend reversal, so watch for it closely.
Strategic Locations for Inside Bars

By understanding inside bars, you can:
- Identify potential reversals in the market.
- Make more informed trading decisions.
- Gain an edge in the exciting world of technical analysis.
Ready to put your knowledge to the test? Go on your charge and look for these candles in support and resistance levels like orderflows, orderblocks, and breakerblocks. Observe inside bar formations on charts and see if you can predict future price movements. Remember, practice makes perfect! But remember to use this as a confluence factor, don’t go in a buy or sell solely on this pattern.
Leave a Reply