| Section | Key Takeaways |
|---|---|
| Understanding the Engulfing Candlestick Pattern | Signifies a power shift between buyers and sellers, indicating potential trend reversals. |
| Beyond the Basics: Variant Engulfing Patterns | Introduces variants where the engulfing candle is significant even if it doesn’t fully encompass the prior candle. Focuses on the size of the engulfing candle. |
| Trading with Engulfing Patterns | Important to identify these patterns in key areas such as support and resistance levels for effectiveness. |
| Time Frames | Engulfing patterns may appear differently across various time frames; understanding this helps in making informed trading decisions. |
| Conclusion | Engulfing patterns should be used in conjunction with other technical indicators for reliable trading insights. |
Written By Zsolt Jirka
The engulfing candlestick pattern is a popular tool for traders. It can give you an indication of potential trend reversals or continuations. However, simply identifying an engulfing pattern isn’t enough. After learning about the Engulfing Candlestick, I pay close attention when it occurs in an area of interest.
Understanding the Engulfing Candlestick Pattern
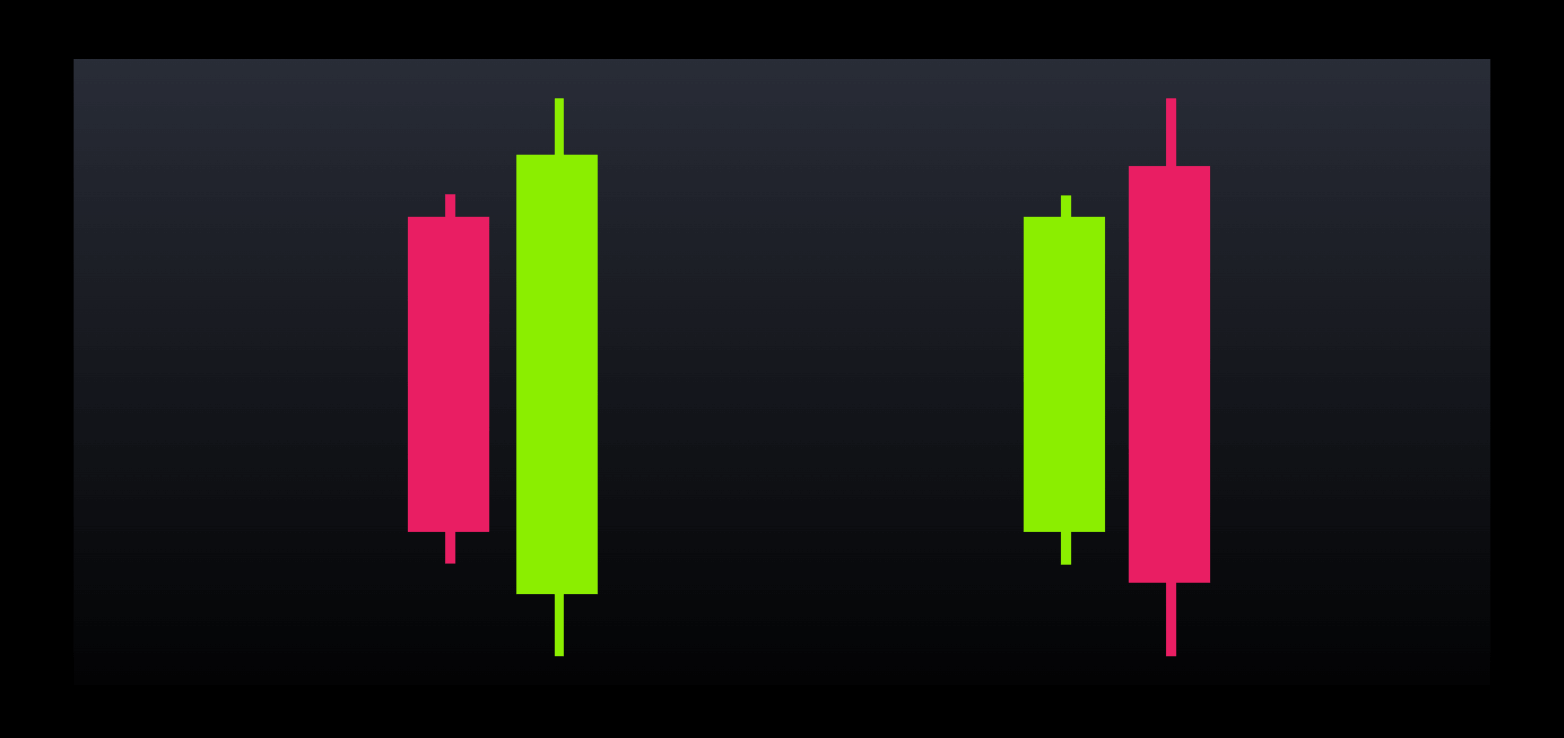
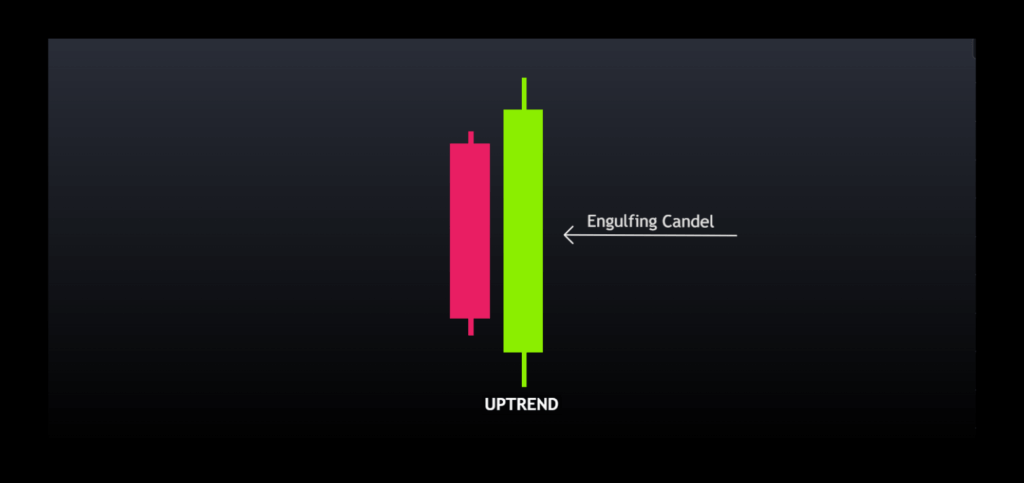
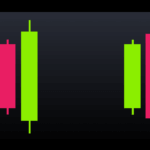
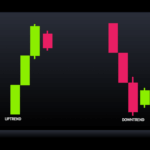
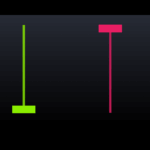
Imagine a battlefield between buyers and sellers. A red (bearish) candle represents the sellers pushing prices down. Then a larger-bodied green (bullish) candle emerges, engulfing the entire range of the previous candle. This signifies a power shift, with buyers overwhelming sellers and potentially reversing the downtrend.
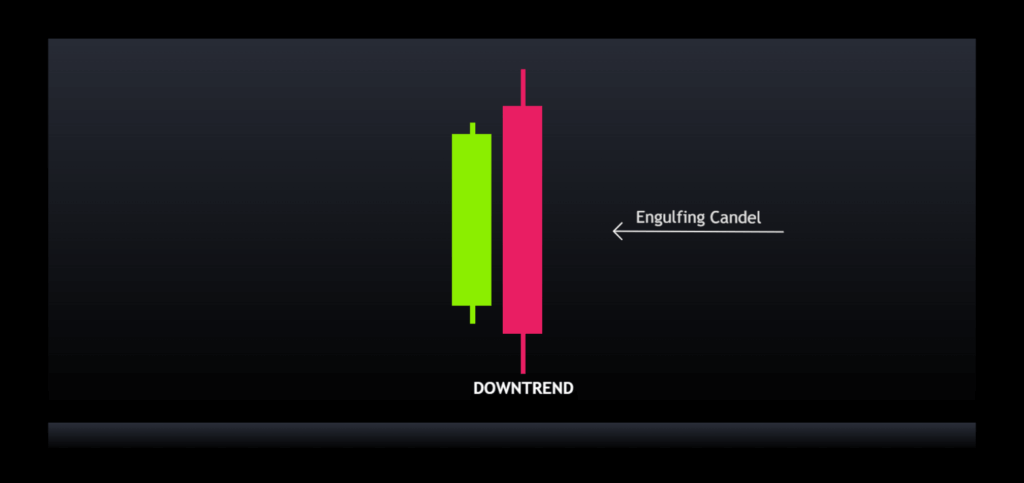
This is the classic bullish engulfing pattern. Conversely, a green candle followed by a large red candle indicates a bearish engulfing pattern, suggesting the sellers are regaining control.
Beyond the Basics: Variant Engulfing Patterns
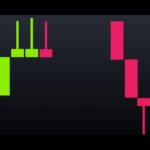
Traditional engulfing patterns require the previous candle’s body to be completely engulfed. But what about situations where the engulfing candle is significant but doesn’t fully encompass the prior candle?
This is where variant engulfing patterns come into play. Here, the focus shifts to the size of the engulfing candle. A bullish engulfing momentum pattern features a large green candle significantly bigger than the preceding candles, even if it doesn’t fully engulf the body. This signifies a powerful surge in buying pressure.
Similarly, a bearish engulfing momentum pattern showcases a substantial red candle, signaling a potential sharp decline.
Trading with Engulfing Patterns
Now that we understand the different engulfing patterns, let’s explore where to look for these patterns.
Location is key. Look in areas of interest like Orderflows and order blocks, or support and resistance levels. It is essential to know where to look for these patterns. If you just look randomly for this pattern, it will work against you.
Since I learned about the engulfing candle patterns, I started to recognize this pattern. However, it only serves me if I use it with other confluences. So, I don’t rely solely on it.
Time Frames
When using multiple time frames, it’s important to note that while the engulfing candle pattern may be visible on one time frame, it might not be apparent on a lower time frame.By understanding this it can help you make more informed trading decisions by considering the context of different time frames.
Looking at Different Chart Intervals
When using charts with different time intervals (daily, hourly, etc.), it’s important to remember that an engulfing pattern might be clear on one but not visible on shorter intervals. By understanding this, you can make more informed trading decisions.
For example, in the first image an engulfing pattern appears clearly on the daily chart. This pattern might not be as obvious on the 1-hour or 15-minute charts. (I’ve drawn a blue line to show the same time period across the charts.) See how the pattern can change depending on the time frame?
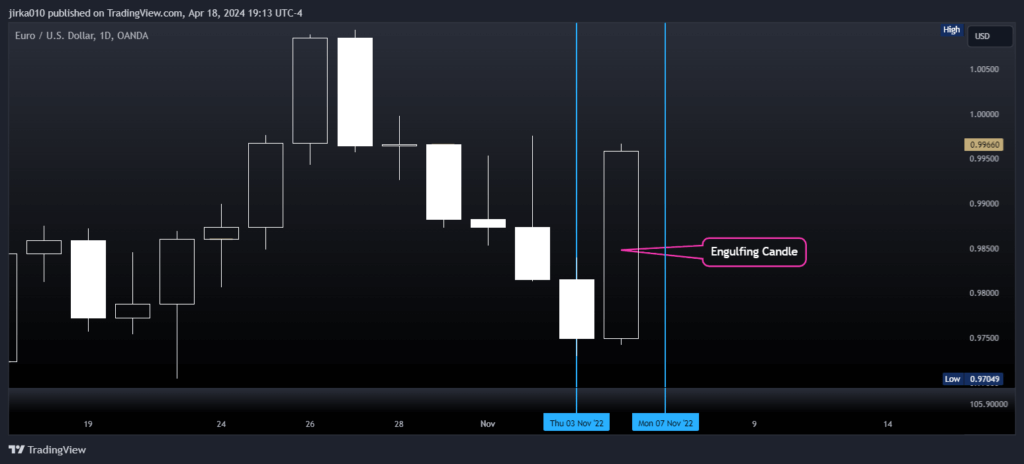
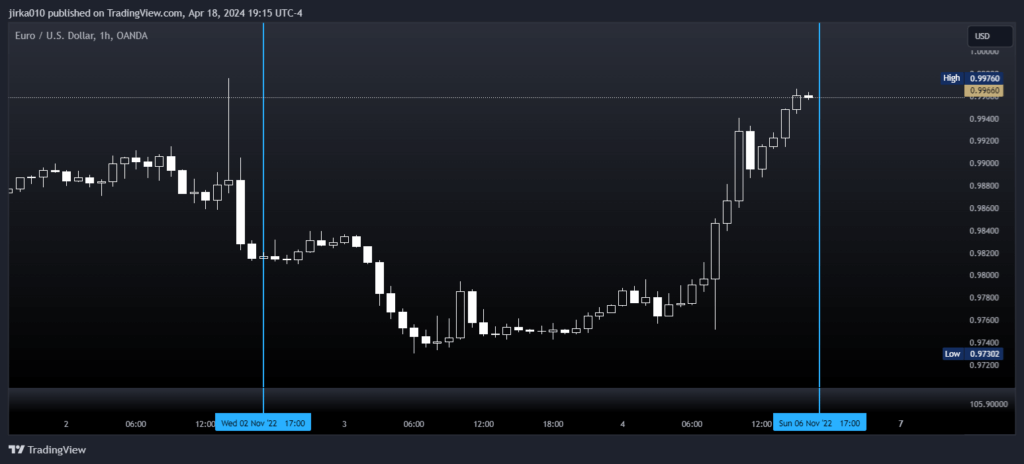
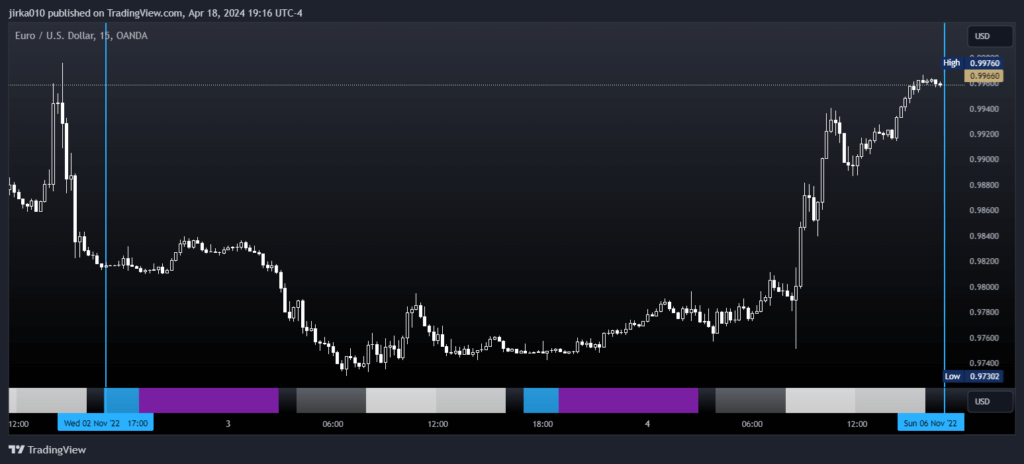
Therefore, examining charts across various time frames allows you to spot engulfing patterns more effectively. This way, you can get a clearer picture of the price action and make better trading decisions.
Conclusion
The engulfing candlestick pattern is a valuable tool for traders, but it should be used in conjunction with other technical indicators and analysis. By understanding the different types of engulfing patterns, their location on the chart, and the role of time frames, traders can make more informed decisions about potential trend reversals or continuations. Simply relying on the engulfing pattern alone can be misleading.
Leave a Reply