| Key Takeaway | Description |
|---|---|
| Definition | Long wicks on candlesticks indicate potential price reversals by showing the battle between buyers and sellers. |
| Context Matters | A long wick alone doesn’t guarantee a reversal; its position relative to support, resistance, order flow, or order blocks is crucial. |
| Confirmation Needed | Always wait for confirmation through additional price action patterns, volume changes, or other market conditions before acting on a long wick signal. |
| Bearish Long Wick | Indicates initial buying pressure followed by strong selling pressure, resulting in the price closing below the opening. |
| Bullish Long Wick | Indicates initial selling pressure followed by strong buying pressure, resulting in the price closing above the opening. |
| Trading Strategy | Identify key levels where long wicks appear, use them as potential reversal signals, and set stop-loss orders just beyond the wick to manage risk. |
| Confluence | Higher probability of reversal when long wicks sweep previous highs or lows and appear at extreme zones of order flow or order blocks. |
| Patience and Discipline | Essential for mastering long wick trading; practice analyzing context and waiting for confirmation before entering trades. |
Written By Zsolt Jirka
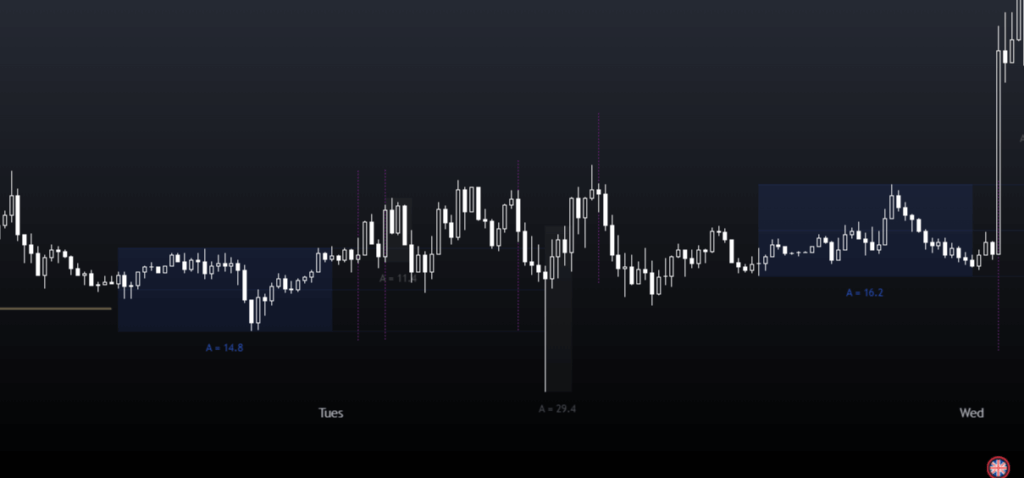
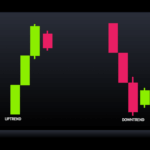
Long wicks in forex day trading can show potential price reversals. But context matters. A long wick by itself does not guarantee that the market is reversing. It is important to consider the wick’s position.
When a long wick appears at a significant level, such as a support or resistance zone, order flow, or order blocks it may be worth paying closer attention to these candles. However, it is always important to wait for confirmation before acting on the signal. Confirmation might include additional price action patterns, volume changes, time, or other conformations.
What is the candle wick in forex trading?
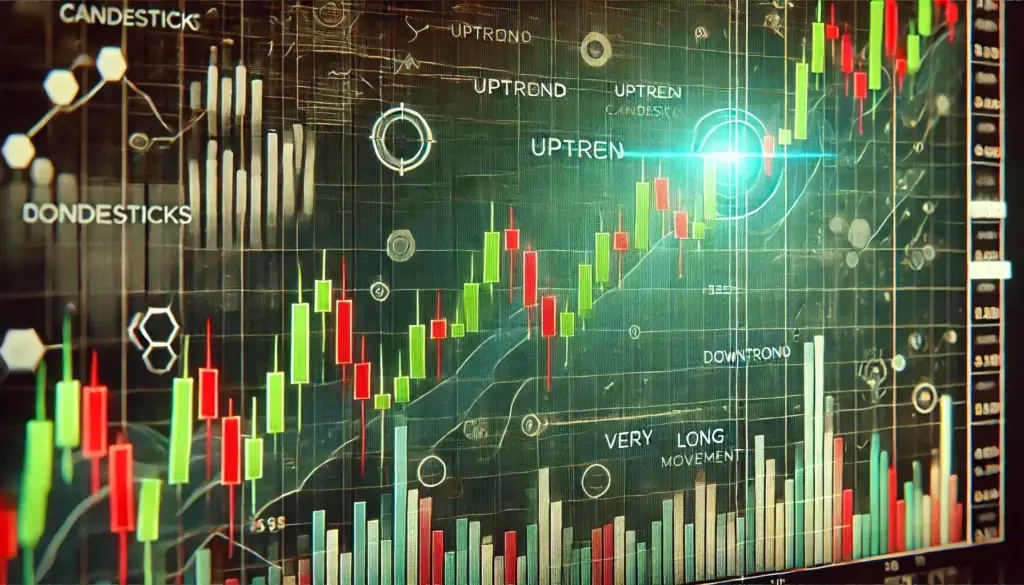
Long wicks on candlesticks can reveal crucial information about market sentiment and potential reversals. By understanding how to trade these formations, you can gain an edge in your trading.
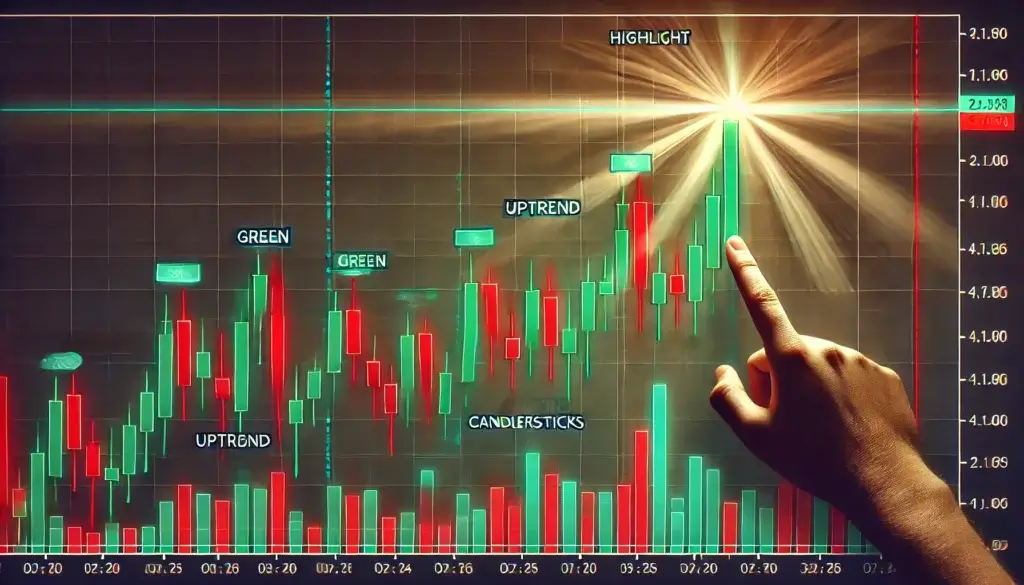
First, identify candlesticks with long wicks, which indicate a battle between buyers and sellers. The longer the wick, the more intense the battle. Next, consider the candle’s position relative to previous price action. A long upper wick after an uptrend suggests selling pressure and a possible reversal. A long lower wick following a downtrend could signal a bullish turnaround.
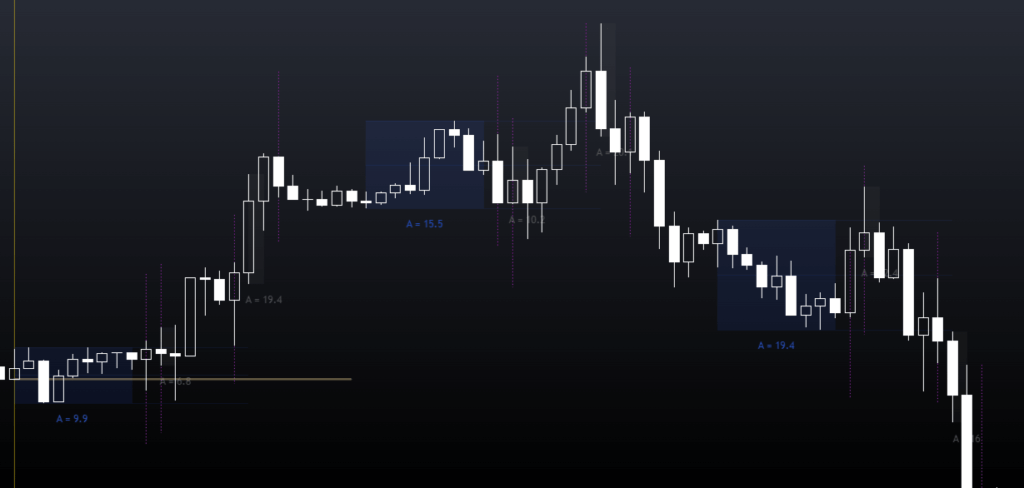
Confirm your analysis with other market context before entering a trade, ensuring that it is on a key level of support or resistance. If you use Orderflows or Orderblock, extreme zones increase the probability that the price will turn.
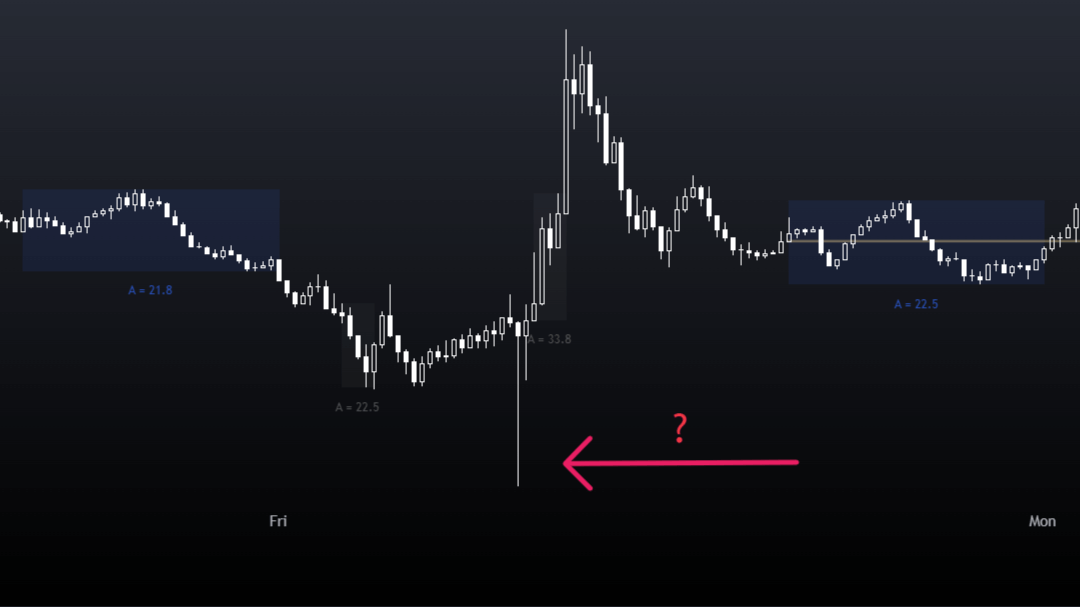
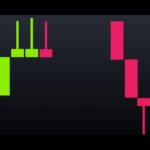
What also can be seen as a confluence is when the long wick is sweeping the previous high or low. This makes the probability higher that the price will turn.
Set stop-losses just beyond the long wick to manage risk. With practice, trading long wicks can become a powerful tool in your arsenal, helping you anticipate shifts in market momentum and capitalize on opportunities. Remember, patience and discipline are key to mastering this strategy.
What Does a Bearish Candle with a Long Wick Mean?
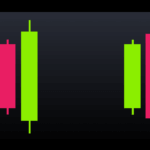
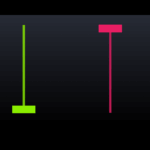
A bearish candlestick with a long wick on the upside. This indicates that, after the candle opened, buyers initially drove the price up. This upward movement shows that there was buying pressure in the market. This causes the long wick. However, as the price reached higher levels, sellers took over, and selling pressure increased. The increased sell orders overwhelmed the buyers, causing the price to drop back down. As a result, the candle closes below the opening price, indicating a bearish sentiment.
What does a bullish candle with a long wick mean?
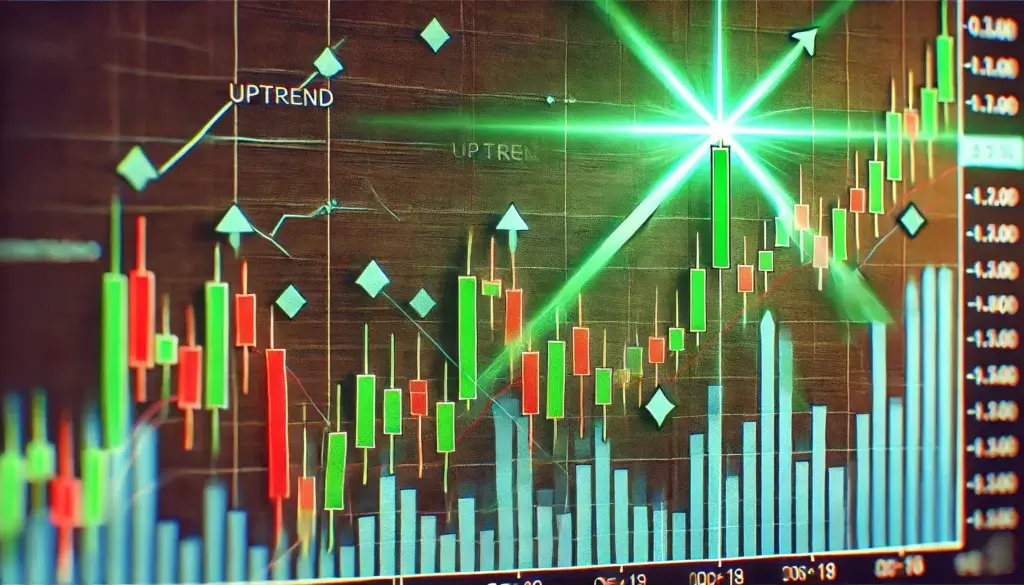
A bullish candlestick with a long wick on the downside. This indicates that, after the candle opened, sellers initially drove the price down. This downward movement shows that there was selling pressure in the market. This causes the long wick. However, as the price reached lower levels, buyers took over, and buying pressure increased. The increased buy orders overwhelmed the sellers, causing the price to rally back up. As a result, the candle closes above the opening price, indicating a bullish sentiment.
How do you trade long wicks?
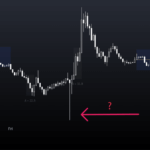
To trade long wicks, be like a detective. Look for clues in the chart, like important price levels where the wicks are appearing. If you spot a long wick right at a key level, it’s a strong sign that the price might change direction.
But don’t rush into a trade just yet! Make sure you have a plan to protect yourself if the price doesn’t do what you expect. Place your stop-loss order just past the end of the long wick, so you don’t risk too much.
With a little practice and patience, you can use long wicks to your advantage and make smart trading decisions. It’s like having a secret weapon to predict where the price might go next!
Leave a Reply