| Key Aspect | Takeaway |
|---|---|
| Fundamental Tool | Japanese candlesticks simplify complex market data into visual patterns, aiding in sentiment analysis and prediction. |
| Historical Significance | Originated in Japan’s Dojima Rice Market in the 1700s, introduced by Homma Munehisa. |
| Anatomy of Candlesticks | Key to understanding market movements; shows open, close, high, and low prices. |
| Market Sentiment Analysis | Patterns like Dojis help decode market sentiment, indicating potential reversals or continuations. |
| Color Significance | Initially black and white for price decreases/increases; modern use includes green and red. Personalization can help avoid emotional bias. |
| Practical Application | Mastering candlestick patterns enhances decision-making ability, emphasizing the importance of ongoing learning. |
| Conclusion | Japanese candlesticks merge historical insights with modern strategies, essential for informed trading. |
Picture this: you’re looking at a stock chart, and it’s like trying to read a foreign language. Lines, colors, and shapes everywhere! But what if I told you that one of the most popular tools, Japanese candlesticks, could be your secret weapon? Not only do they have a cool history, but they can also help you understand what’s really going on in the market.
In this guide, we’ll focus on mastering candlesticks first. But guess what? There’s a whole world of charts out there waiting for you! Some charts track prices like building blocks, while others use Xs and Os to uncover hidden patterns. You’ve got simple line charts that show you the big picture and bar charts that give you a snapshot of what traders are thinking. And if you want a smoother journey, there are even special candlesticks that help you focus on the most important trends.
We’ll explore these other charts later, but for now, let’s dive into Japanese candlesticks and become chart-reading ninjas!
The Historicy of Candlestick Patterns

A long time ago, in the 1700s, there was a place in Japan called the Dojima Rice Market. People would go there to buy and sell rice. One super smart trader named Homma Munehisa came up with a clever way to look at the prices of rice. He’s now known as the “Father of Japanese Candlesticks.”
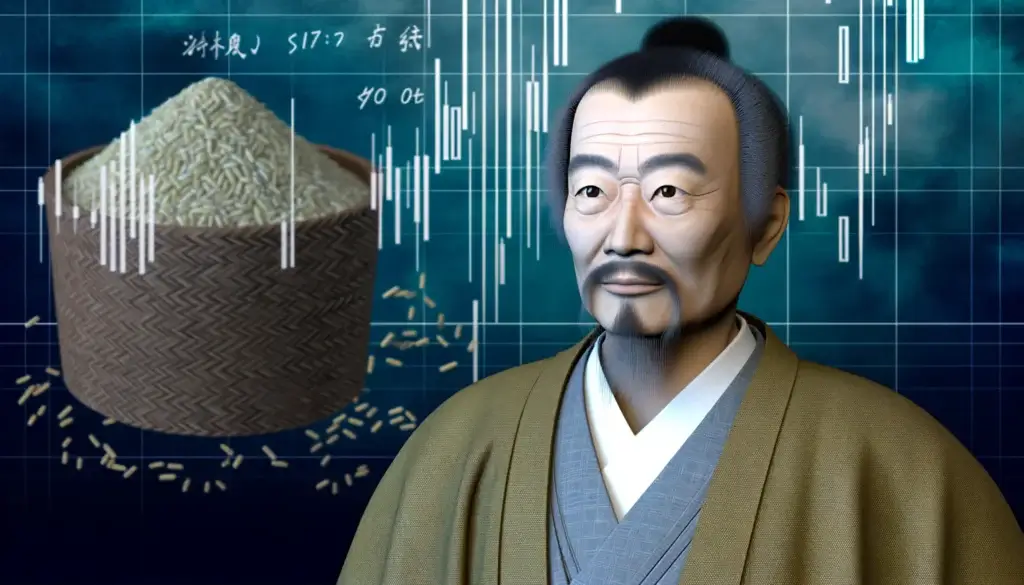
Homma Munehisa said something really wise: “When everyone thinks prices will go down, they might actually go up. And when everyone thinks prices will go up, they might actually go down.” Even today, this idea of knowing what the market feels (sentiment) is very important. This is just like what famous investors like Warren Buffett say.
Deciphering Candlestick Charts
Now, let’s talk about how to read these special charts. Each candlestick on the chart shows you the price of something (like rice or stocks) for a certain amount of time. It could be a day or even just an hour.
The Anatomy of a Candlestick
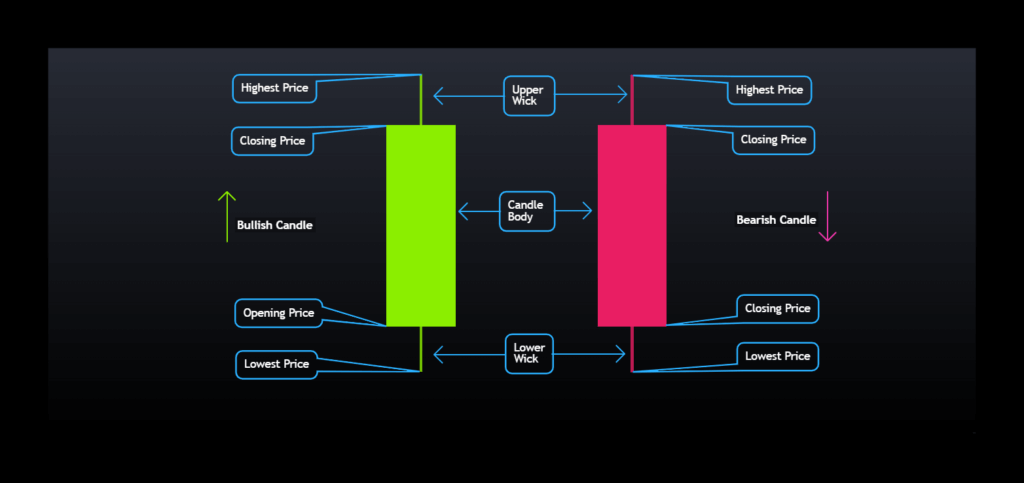
The candlestick has a few parts:
- The opening price: where the price started
- The closing price: where the price ended up
- The highest price: the most expensive price during that time
- The lowest price: the cheapest price during that time
- The range: the difference between the highest and lowest prices
Understanding these components is just the beginning. The colors and patterns of these candlesticks can also tell us a lot about market sentiment.
Exploring Market Sentiment
Over the next few posts, we’ll delve into these “secret messages.” The most common candlestick patterns, Dojis, and the psychology behind them. We’ll explore what they tell us about market sentiment and how you can use this knowledge to make informed trading decisions.
The Role of Color in Candlestick Charts
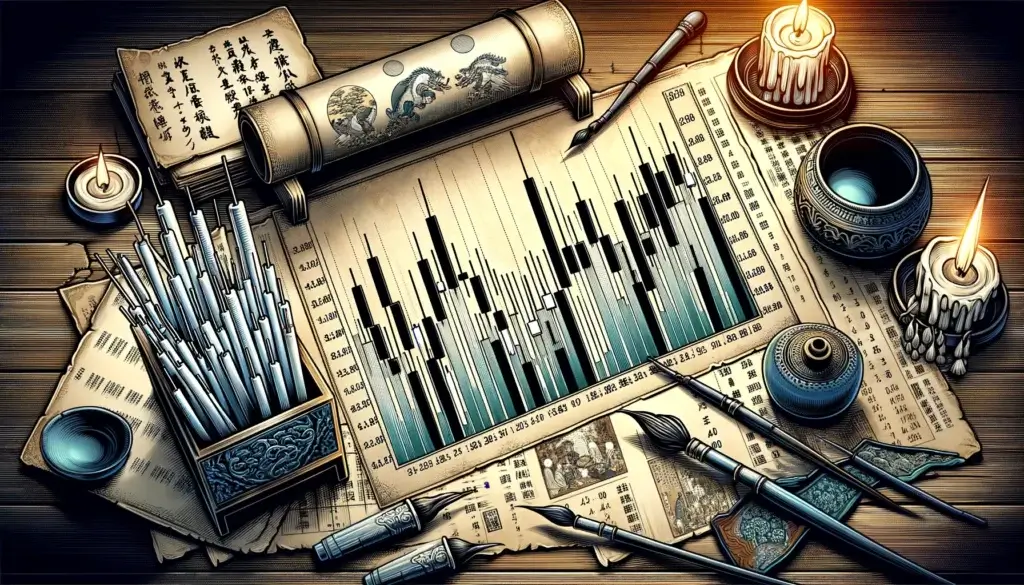
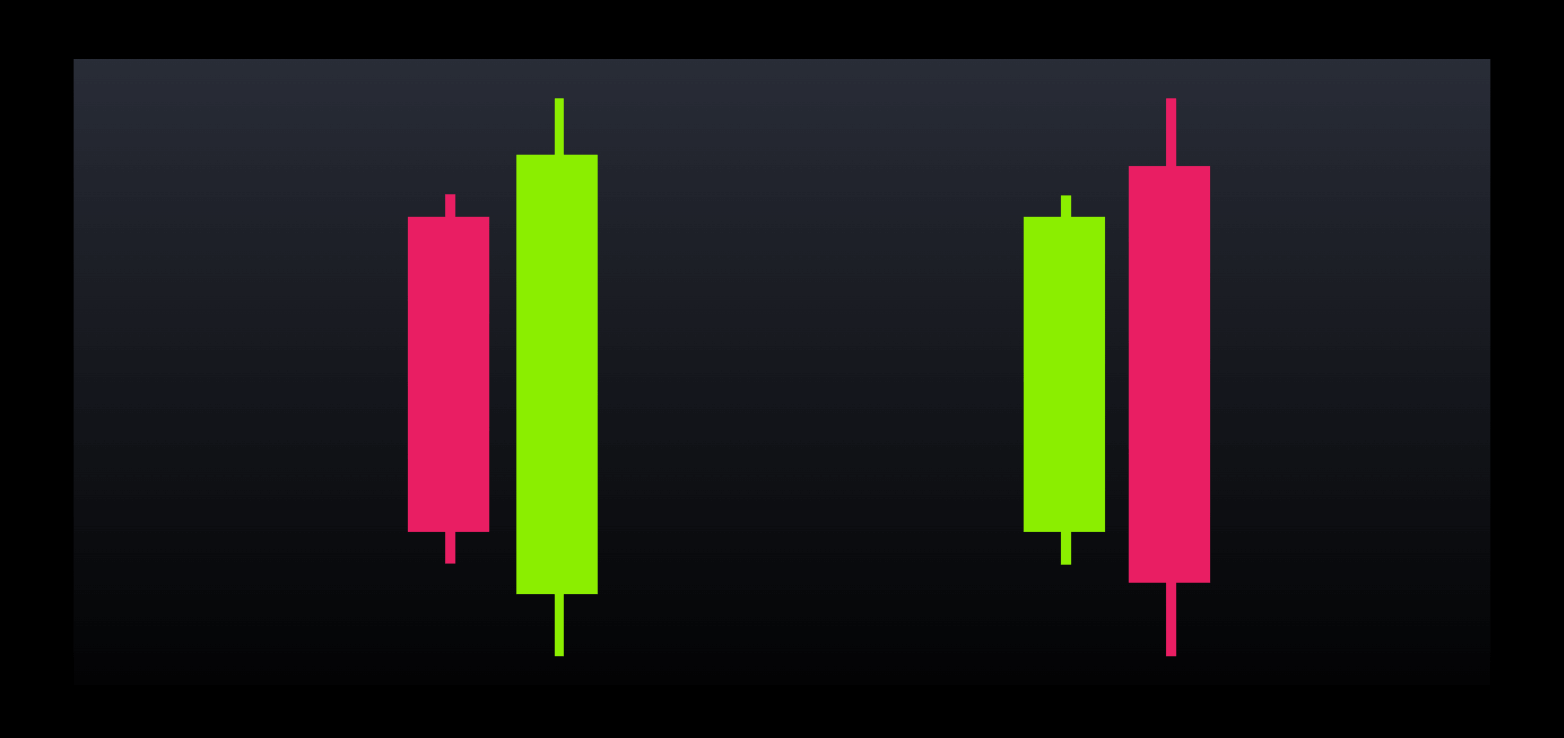
Have you ever wondered about the colors used in Japanese stock charts? It’s quite interesting! In the past, these charts only used black and white bars. A black bar meant the stock price decreased that day, while a white bar indicated an increase.
Nowadays, most traders prefer using green bars for days when the price goes up and red bars for days when it goes down. But here’s the cool part – you can actually choose any colors you like for your charts!
Personal Color Preferences
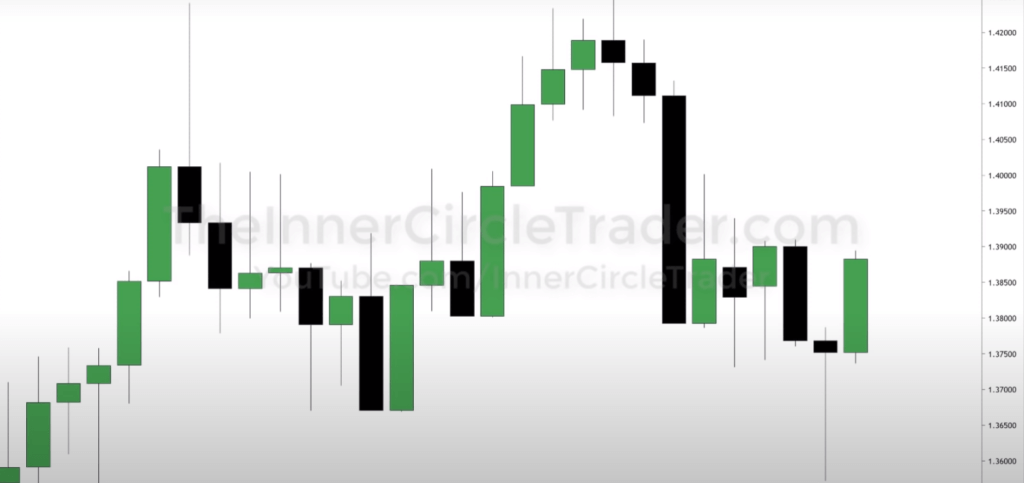
Some traders, like the famous ICT trader, use green and black bars. Others, like myself, prefer white candles with black bodies. The reason I don’t use green and red is that these colors can sometimes influence my emotions. In trading, it’s important to stay neutral and avoid letting emotions guide your decisions.
Green might give you a positive feeling, while red could make you feel negative. However, these emotions aren’t always helpful when making trading choices. That’s why I opt for colors that don’t impact my emotions, helping me stay focused and make clear decisions based on the data in front of me.
It’s fascinating to see how something as simple as color choice can play a role in trading strategies. The next time you look at a stock chart, take a moment to think about the colors being used and how they might affect your perception of the information.
Candlestick Details
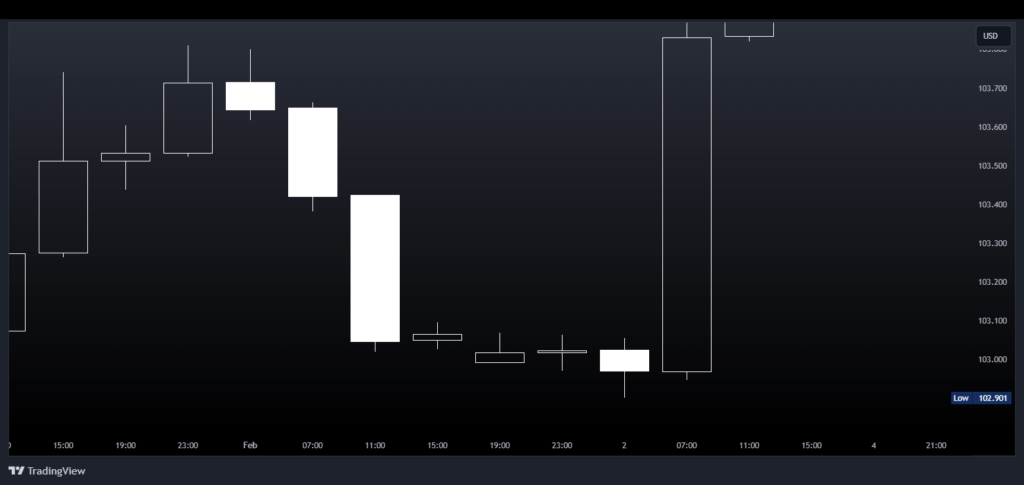
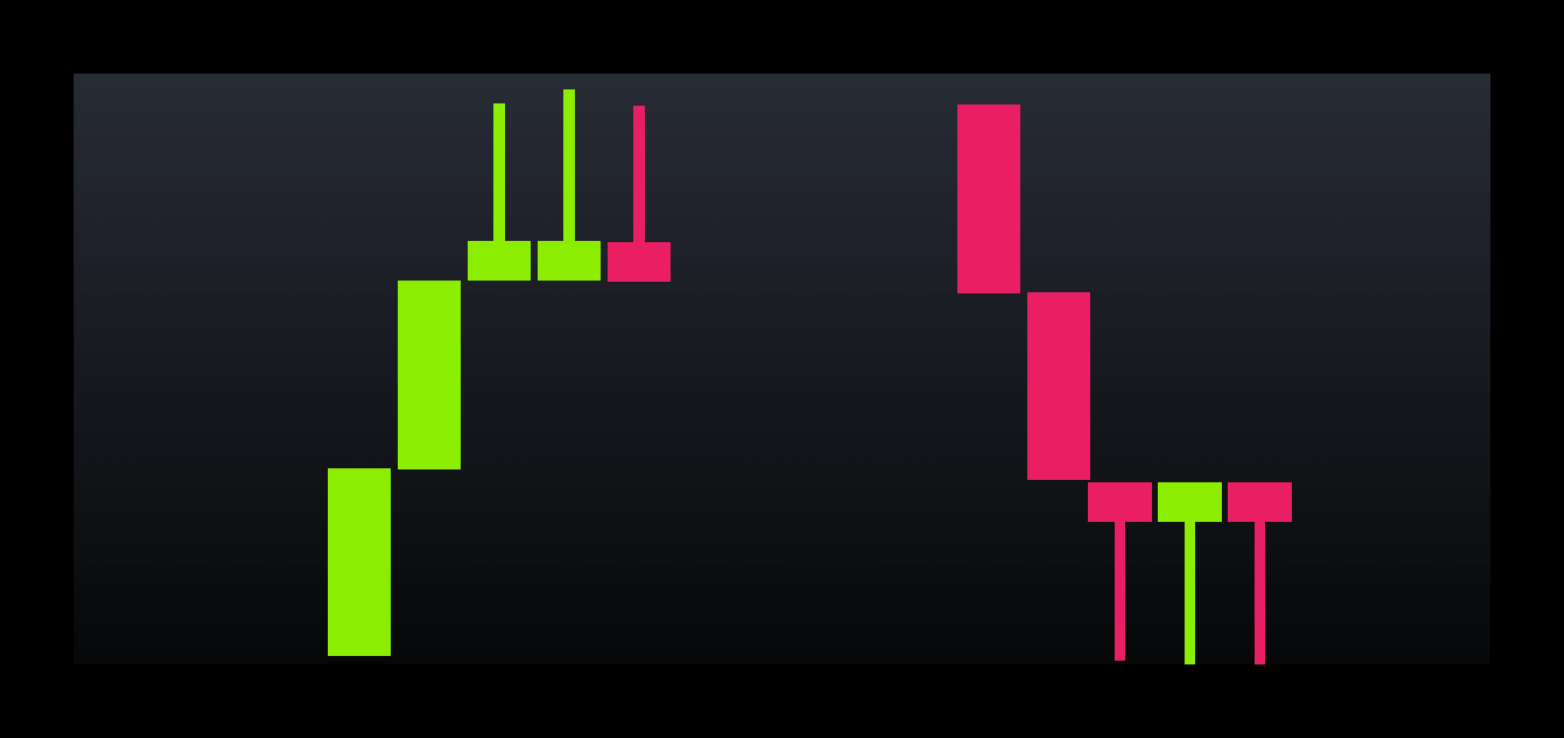
The colored part in the middle of the candlestick is called the “real body.” It shows you the difference between the opening and closing prices. The lines above and below the real body are called “wicks” or “shadows.” They show you the highest and lowest prices.
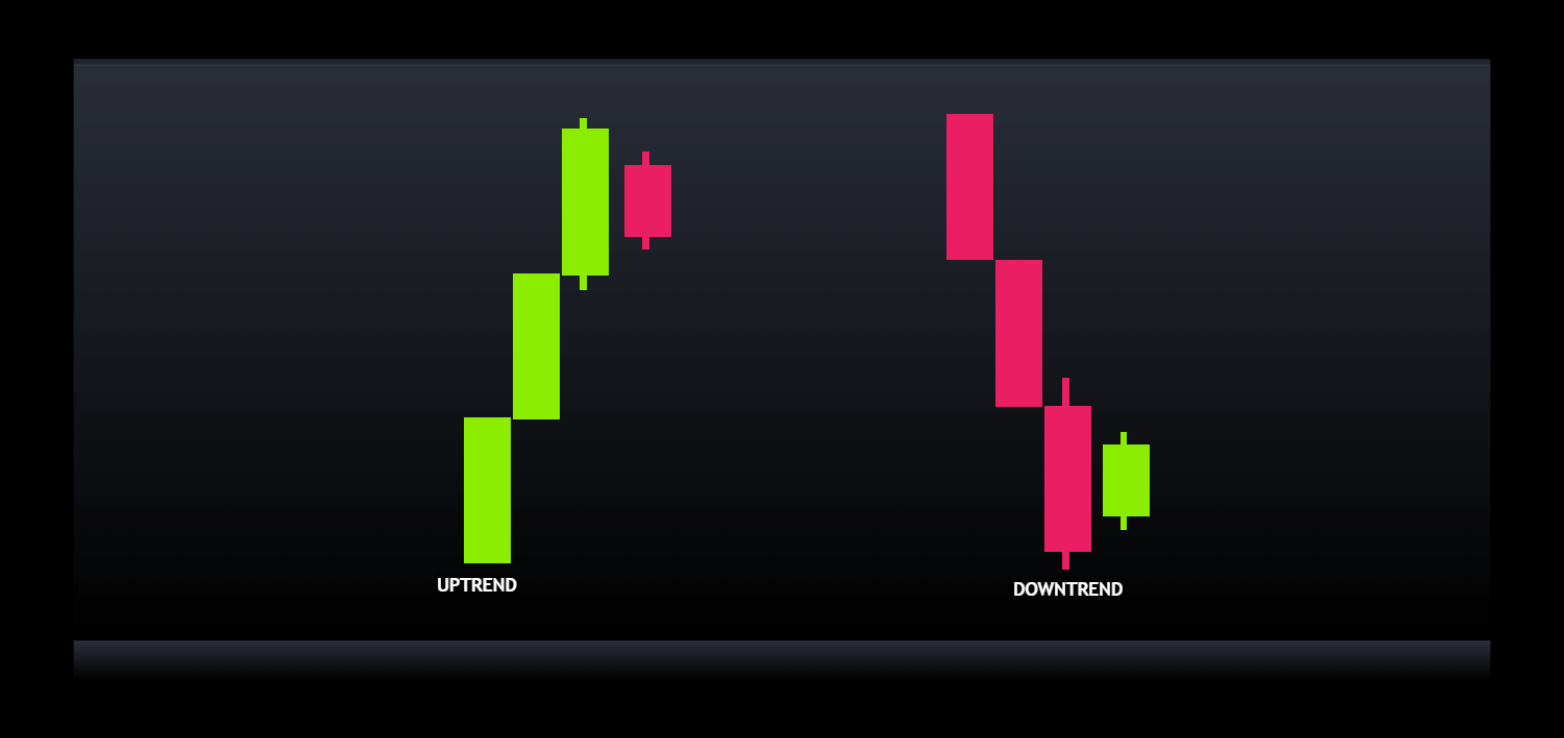
By looking at the patterns these candlesticks make, traders can learn a lot about how people feel about the market. They can see if more people are buying or selling, and if the price might change direction soon.
Conclusion
So, Japanese candlestick charts have a pretty amazing history that goes back hundreds of years! They’re still used today by people who buy and sell stocks and other things. By understanding how to read these charts, you can become a smarter trader and make better decisions. Just remember what Homma Munehisa taught us: always think about how everyone else is feeling about the market!
“Dive deeper into each candlestick pattern in our upcoming posts and unlock the secrets to becoming a more informed trader.”

